The People Side of Fundraising – Part 1
How many fundraisers do you need to meet your fundraising targets? How is staff being deployed in this ever-changing and increasingly competitive marketplace? What roles are they playing? How long are they staying? And how much money should a fundraiser be expected to raise?
Such critically important questions to which there have long been few, if any, answers.
In an effort to close that gap, KCI’s Research + Analytics team has undertaken a number of benchmarking studies and targeted compensation reviews over the past several years. When pooled with the knowledge and insights generated through our Search + Talent practice, the findings from these projects have enabled us to identify key trends and practices with respect to paid fundraising staff and its deployment.
In this article, Part 1 of a two-part Series, we present some general trends and benchmarks that are valuable when planning and developing staff utilization strategies. A second article will follow shortly that focuses on the strategies and methods that charities are employing to recognize, reward and incentivize staff, and how those practices are contributing to retention.
The specific data sources on which these findings are based can be found in the box How did we generate these insights? We want to extend a very big thank you to all organizations that participated in these various research projects and whose data have, in part, informed our findings. Not only did their participation support their own success by building a deeper understanding of their particular situations, they have also been invaluable in building and deepening our knowledge and understanding of the sector and our craft.
How did we generate these insights?
While the findings shared in this article are drawn from a variety of input sources, they have been particularly informed by our 2019 KCI Hospital Foundation Benchmarking Study. Conducted every three years, it brings together Canadian hospital and healthcare foundations in order to better understand compensation levels and practices and to establish sector-specific benchmarks and salary ranges. The insights gleaned from the Study not only inform organizational best practice related to compensation and staff allocation, but when compared over time yield rich insights into the shifting nature of the industry.
In 2019, 37 foundations participated in the Study, representing a diverse range of foundation size, type, and geography. The participating foundations provided the data related to the following:
- The institution they support, and the reciprocal support it provides the Foundation;
- Campaign status, goal and progress;
- Foundation revenue and donor counts;
- Details for ALL positions in the foundation, including responsibility allocation, supervisor, tenure of incumbent, management responsibilities and more; and
- Compensation details for each position, including base salary amounts + incentive compensation (if applicable), benefits and perquisites.
As with all our studies, organizations provided the data confidentially, and KCI analyzed and categorized the information to produce detailed benchmarking results. In particular, we coded and classified foundations and positions to ensure comparisons were fair and appropriate, and that findings remain confidential when presented. Each foundation received a 100+ page report with summary-level findings and insights, and a detailed benchmarking section that shows exactly how their foundation and position compensation ranks against peers while preserving participant confidentiality.
Our findings have been further informed by insights from numerous other sources, all of which have been factored into the conclusions and insights being shared in this Series:
- KCI’s Executive Search + Talent practice, which has worked with over 500 charities over the past decade.
- Customized compensation reviews conducted for over 40 senior fundraising and leadership positions in 2018 and 2019.
- The 2018 KCI Leading Indicators & Activity Metrics benchmarking study.
- KCI’s benchmarking studies in the Canadian higher education sector.
- Our work with clients across Canada on campaign studies, revenue generation plans, and capacity assessments in particular.
General Trends and Practices
The ways that charities are organizing, deploying, and finding their staff are changing. The following is a summary of the key changes we are observing.
ONE: TRADITIONAL FUNCTIONAL AREAS ARE SHIFTING AND LINES ARE BLURRING.
The delineation between the roles of ‘fundraiser’, ‘marketer’ and ‘analyst’ is not as sharp as it once was. The rise of digital fundraising and the need for strong associated marketing, communications, and technical savvy have brought increasing overlap between Marketing & Communications, Community Relations, Events, Annual Giving / Direct Response and Information Technology. Community engagement and mass philanthropy programs are also requiring new skills, as well as comfort with a wide range of online platforms (both current and future). Successful organizations are further reinforcing this skill set with strength and a comfort level in number-crunching and analytics. Related to this trend, the number of IT positions in fundraising has seen tremendous growth, with individuals who balance technical expertise with knowledge of fundraising practice in greatest demand.
Integration between the relationship-focused areas of fundraising, notably major and planned giving is becoming more and more common. Many organizations are ensuring that fundraisers who engage with donors and prospects on a personal level are comfortable with all types of giving. They are also talking to donors about ‘blended’ gifts that include both present and future commitments much more often than ever before.
Finally, mid-level giving continues to straddle both the mass philanthropy and major gifts functions, but is definitely an area of increasing specialization for professionals.
TWO: EMERGENCE OF SENIOR STRATEGY EXPERTS TO HELP ORGANIZATIONS NAVIGATE.
Working closely with organizational leadership, senior positions focused on organizational strategy is a growing trend. Often one position or a very small team, these roles are typically independent of functional units but tasked with driving forward key initiatives that may involve the whole organization.
These positions tend to either report directly to, or work very closely with, the most senior fundraising leader in the organization. In smaller fundraising enterprises, these individuals are sometimes an experienced former leader, now semi-retired, in an ‘internal consultant’ role. At larger organizations, they are often people with high levels of both technical and fundraising expertise whose focus is identifying opportunities, assisting with high-level case and strategy development, and leading transformational projects.
THREE: TURNOVER CONTINUES TO BE A FACTOR, ALTHOUGH NOT IN ALL FUNCTIONS.
Turnover of key fundraising positions has historically been of significant concern for charities. Our 2019 Hospital Foundation Study probed incumbent turnover and tenure for the first time, and uncovered some interesting findings.
Overall, staff were in their current positions for an average of 3.1 years, and at the organization (all positions) for 5. 2 years. However, senior roles had much lower turnover. CEOs averaged 6.5 years in their roles, while Vice Presidents had been in there current roles for 3.5 years and 6.5 years with the organization overall. Finance, Operations, and administrative staff also tended to have longer tenures.
Front-line positions, particularly Coordinators and Officers in Development and Marketing & Communications, did have much higher rates of turnover. Officers and Coordinators in both functions averaged 1.8 years in their current job, and 3.0 years at their respective foundations. Finally, Managers in Development and Marketing & Communications averaged 2.1 years in their role, and 5.3 years at their organizations.
FOUR: ‘GROWING YOUR OWN’ IS GROWING IN FOCUS AND IMPORTANCE.
Given the ongoing challenges in attracting top talent combined with the turnover stats noted above, organizations are placing more emphasis on developing and promoting current staff…and are investing more resources to doing that. These investments include professional development, training budgets, flexible work options to support staff in managing personal and professional commitments and a greater willingness to mentor staff to reach the next level.
Accompanying this increased emphasis on human capital is a greater investment in HR (human resources) staff. We observed from our Hospital Foundation Benchmarking Study that larger hospital foundations in particular appear to be growing and strengthening their internal HR functions in order to execute their growing focus on attracting, recruiting, and supporting employees.
Benchmarks
Supplementing these general trends, our work has identified several benchmarks that are useful to inform staffing decisions and allocation…and that also spotlight some ‘secrets to success’ of high-performing organizations. Data for these benchmarks come from our 2019 Hospital Foundation Study, but we believe they are comparable to other sectors when thinking of the ‘advancement operation’ as a whole, including prospect research, finance, marketing, and other support staff.
REVENUE PER POSITION AND PER FUNDRAISER
Understanding the appropriate expectation of revenue per FTE (full time equivalent) is enormously instructive when considering staff requirements relative to fundraising targets and ambitions. How many fundraisers do we need? What should we expect them to raise?
It is important to note that these benchmarks should be considered ‘guidelines’ as opposed to ‘hard and fast rules’ as there are a number of factors that will influence their applicability to particular situations. Details on those factors can be found in the box entitled Revenue per FTE Benchmarks: Approach with Caution.
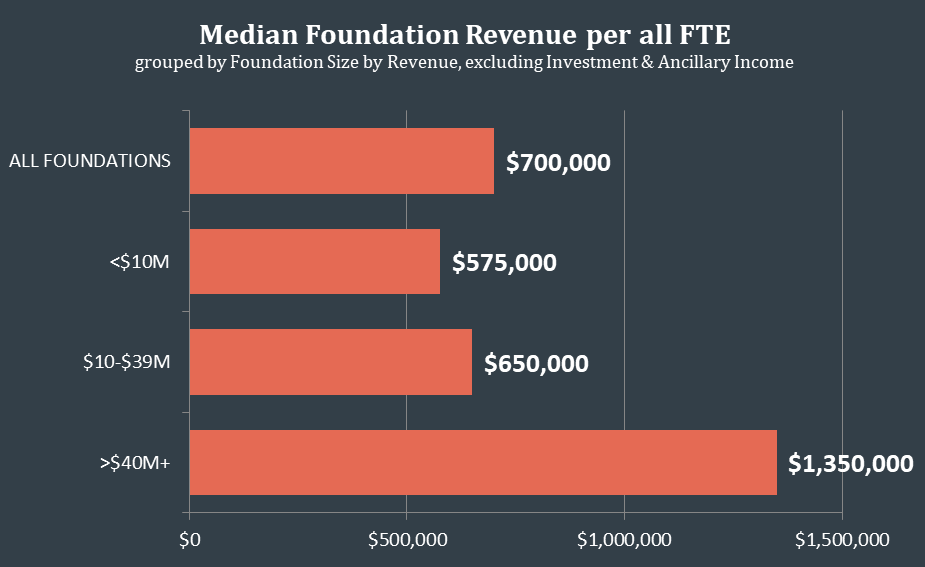
When comparing all revenue[1] to all staff (including support roles), $700,000 per full-time equivalent position can be considered a rough benchmark. In other words, if an organization has a fundraising goal of $7M annually, they will likely need at least 10 total staff in the foundation/unit
Larger revenue organizations do raise more money per person, with the largest reaching over $1M per full-time equivalent head count.

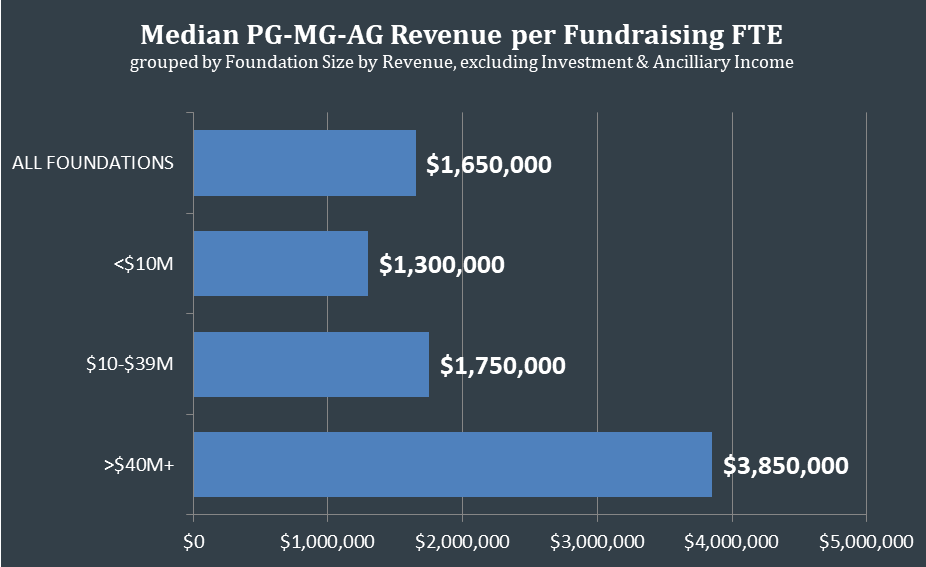
When only revenue from Principal Giving, Major Giving and Annual Giving is considered and compared only to the staff directly allocated[2] to this area, the revenue per FTE is much higher at $1.65 million (median) to $2.2 million (average).

Given these findings, a rough ‘rule of thumb’ for most organizations can be $2M per full-time fundraiser, but it is important to note that this presumes a full fundraising program (major, annual and planned giving, events etc.) and a complement of staff to support them. In other words, it takes a team to make a fundraiser successful. This $2 million benchmark consistent with previous versions of the Study but it will likely climb over time given inflation. It is also important to note that the largest organizations, which often receive the largest gifts, are consistently outperforming this ‘typical’ value.
Revenue per FTE Benchmarks: Some words of caution
These benchmarks should be approached with care and caution, as in KCI’s experience, organizations will have variations in the production capacity of fundraisers due to numerous factors, including:
- Fundraising program maturity, particularly with respect to major giving
- Philanthropic potential of the charity’s catchment area and the prospect pipeline.
- Local and regional economic factors
- Inclusion (or absence) of significant major or planned gifts
- The presence or absence of a support or ‘enabling’ team for the fundraiser (e.g. research, operations, communications, stewardship etc.)
On an individual level, a specific fundraiser’s performance will also vary based on their specific role, the value and maturity of their portfolio, their level of experience, the capacity of the community among other factors.
TEAM COMPOSITION
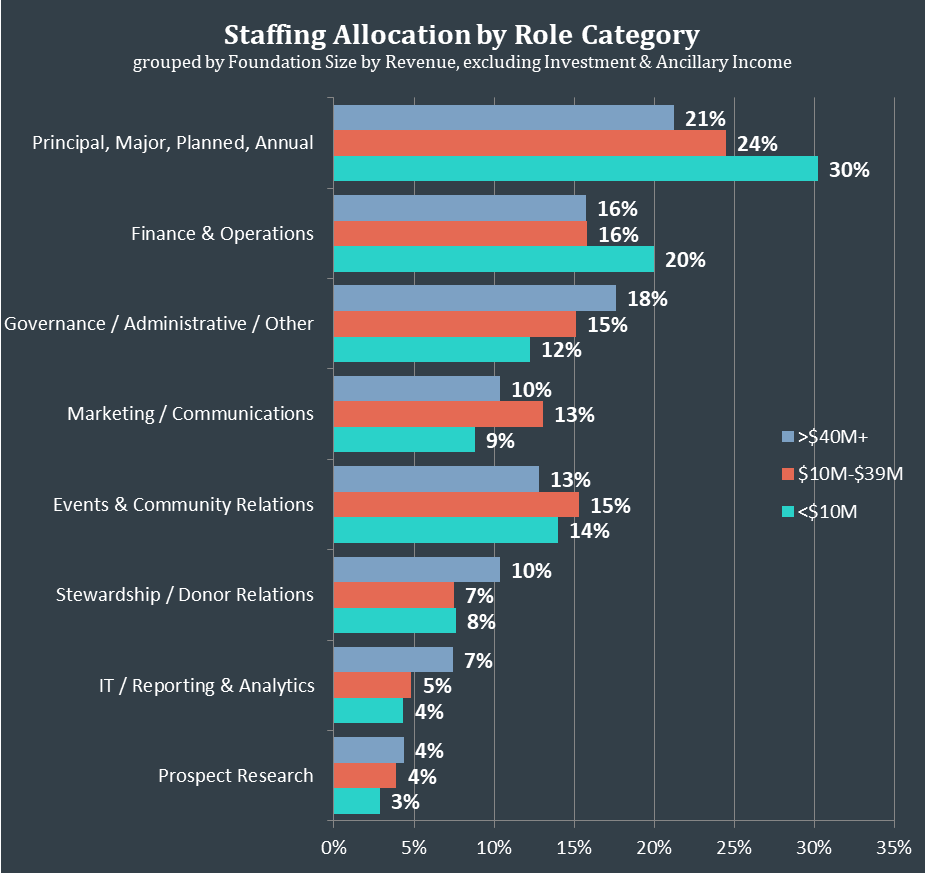
In saying ‘it takes a team’ for a fundraiser to be successful, it is interesting to note what that team looks like. This chart illustrates the proportion of staff (including portions of positions that have duties in multiple areas) by organization size.

Foundations that had the most revenue per fundraiser tend to have proportionally more human resources allocated, not to fundraising, but rather to areas like Governance & Administration, Stewardship & Donor Relations, IT & Analytics, and Research. This is consistent with findings in previous versions of our Study, and may be related to the increased need for expert technical and supporting roles as organizations grow in size and complexity. But, it provides evidence that the path to increased revenue is not solely through the addition of fundraisers, but can also be achieved by ensuring front line fundraisers are equipped with an adequate team, solid information informed by analytics, and strong stewardship to maintain relationships.
It can also be helpful to think of the proportions noted in the chart in terms of relative ratios or ‘rules of thumb’ around typical staffing levels. For instance, on average:
- One full-time prospect researcher typically supports approximately 6 full-time fundraisers in Principal, Major, Planned and Annual Giving.
- Finance & Operations staffing tends to be around 2/3 of the resources focused on fundraising, excluding events. In other words, there are two Finance & Operations staff members for every three fundraisers.
- Approximately one full-time stewardship professional for every 3.5 fundraisers.
To round out our exploration of the People Side of Fundraising, watch for our next article where we explore the strategies and methods that charities are employing to recognize, reward and incentivize staff, and how that is contributing to retention.
[1] Excluding investment income, but including events, realized bequests, etc.
[2] We ask our study participants to tell us what proportion of each position in their organization falls into specific areas. For example, if a full-time Community Giving Officer spends 50% of their time in Annual Giving, and 50% on Events, we include 0.5 FTE in the Annual Giving total for the organization. So, it’s important to consider the total proportion across your full team, including the time your executive actually spends fundraising.
